There are now two versions: one for F77, and one for F90. We are in the midst of a big shift to F90 in our group, and I would appreciate any suggestions about F90 idioms from which I might benefit, as applied to the enclosed code.
First a manifest, then short instructions, then the tgz file itself.
brem/as77.out           -- output file from run with Absoft F77 (v4.4)
brem/as90.out           -- output file from run with Absoft F90 (v1.01)
                        --    source file is brem.f90 for above
brem/as90_on_77src.out  -- output file from run with Absoft F90, but
                        --    using F90 as an F77 compiler (brem.f source)
brem/brem.f             -- main source file (F77 version)
brem/brem.f90           -- main source file (F90 version)
brem/brem77             -- F77 version compiled -O with Absoft F77 v4.4
brem/brem77_compf90     -- F77 version compiled -O with Absoft F90 v1.01
brem/brem90             -- F90 version compiled -O with Absoft F90 v1.01
brem/c90_v_77.ps        -- comparison of results with
                        --    F90 version vs F77 version
brem/gammln.f           -- math routine needed for brem
brem/params.h           -- header file used by brem
brem/thin.inp           -- input file for test run
brem/brem_f2c.f         -- source file for F2C compilation.  F2C does not
                        --    like "ES" format used in brem.f version.
                        --    You might try this if your compiler coughs
                        --    on brem.f

Compile: (this example uses f2c compiler)

        fort77 -c -O4 brem.f
        fort77 -c -O4 gammln.f
        fort77 -o brem brem.o gammln.o

        time brem < thin.inp > thin.out

For the F90 version, I used the following command to compile (Absoft
compiler):
        f90 -o brem90 -O brem.f90 gammln.f
The numbers quoted on my web page come from summing the system and user times reported by this command.
The program computes the energy spectrum which is observed when a beam of monoenergetic medium-energy electrons passes thru a thin slab of material. The input file "thin.inp" specifies a slab of tungsten, 0.2 mm thick, and an electron beam energy of 800 MeV.
The package, which contains both the F90 and F77 code, can be ftp'd by following this link.
paste as77.out thin.out | gawk '{ print $1, ($4 - $2)/$2 }' > arlo
and then plot "arlo" using GNUplot or some similar program. Differences
should be at the few ppm level or below; the above command finds the fractional
difference between your run and mine, using mine as the baseline. So if
your run agrees perfectly, you should simply get a file full of zeroes
(in the second column).
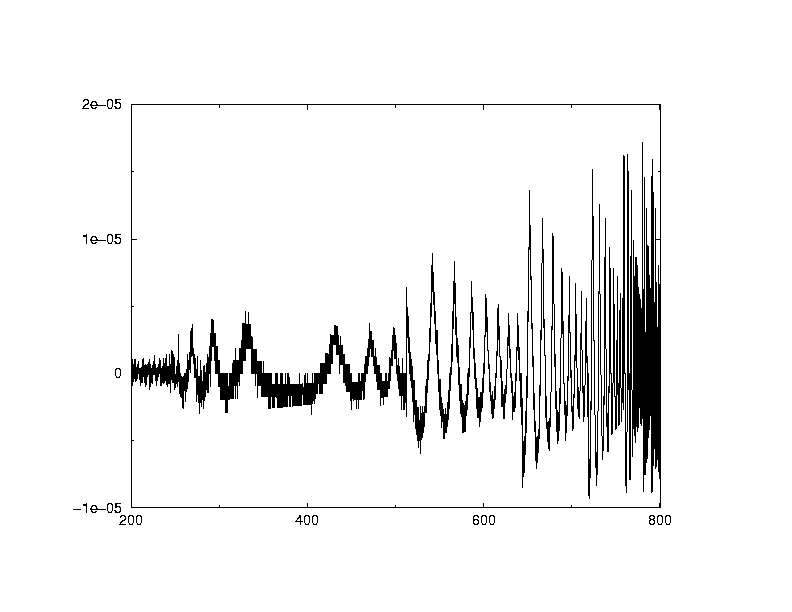
There is some difference between running the F77 and F90 versions on my machine, and the differences are bigger than I would like by about a factor of ten. See the plot below (which looks at the fractional "error" of the F90 run, using the F77 run as a baseline.) This only happens when using F90 syntax; running the F77 source through the F90 compiler and using that executable generates a much smaller difference (all below 1 ppm). In the plot below, the fractional difference (y-axis) behaves about as I expect for x-values below 250. Above this, it goes crazy.
I have observed similar large differences between a run using Absoft
F77 and f2c/gcc (using the fort77 driver script). Anybody who figures this
out, please contact me!